Explaining The Audiogram
An audiogram is a document that we use in Practice to take a record of a hearing test. In other words, it is the hearing test graph that we record the hearing test results on to show how well a person can hear different types of sounds. It is used to determine if a person has a hearing loss, and if so, how bad that loss is. In essence, the audiogram is a record of the lowest sounds you can hear.
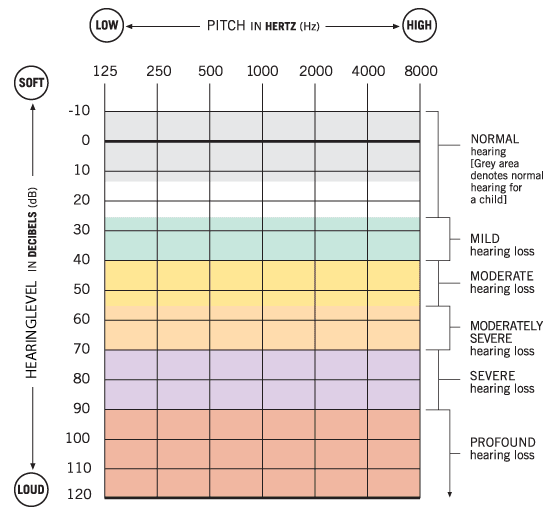
Blank Audiogram
Understanding an Audiogram
The audiogram above is empty, no test results have been recorded on it yet. You can see down the left-hand side the numbers starting at -10 and going up to 120 – these numbers represent the decibel level (volume) at which you can hear a particular sound. The higher the number, the louder the sound. The decibels (-10 to 120) down the left-hand side represent the full safe range of human hearing. The numbers running along the top, from 125 to 8000, represents the frequency or pitch of different sounds, from low pitch (for example a tuba, cannon shot or distant thunder and the vowels in speech) through to high pitch (for example breaking glass, a baby’s scream or a bird singing and the consonants in speech).
The Frequencies of Speech
These frequencies are tested because they are important frequencies for human speech. In essence, all hearing tests undertaken are primarily focused on speech. You may have the ability to hear at higher frequencies than are recorded on the chart or tested, but they are unimportant for the understanding of speech. Low frequencies in speech tend to be the vowel sounds in speech, high frequency sounds in speech are the consonant sounds in speech. Vowels have more power, they are formed in your chest and travel well, consonants are formed in your mouth, they don't travel well but they are the sounds that form the clarity of speech. Without them, speech is all mumbling.
Levels of Hearing Loss
The wording on the right of the audiogram above groups the decibels to show different levels of hearing loss. If someone was tested on a sound and they heard it at 10 decibels (dB) then they have normal hearing ability for that sound – if they could not hear that sound until it was played at 50dB then they have a moderate hearing loss for that sound. You won’t see the groupings on the right hand side on most audiograms
The Hearing Test
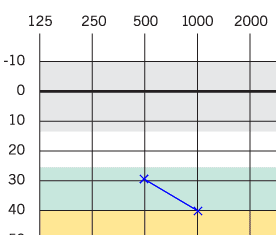
During a hearing test, different sounds will be played at different frequencies and intensities, usually starting at 1Khz (1000 Hz) and progressing through to the high pitches before testing low pitches. For each pitch the sound will be played clearly at an intensity you can hear, it will then be reduced to a level you can no longer hear. The intensity will be increased until the softest intensity you can hear it at is found. The the audiogram is then marked to show the decibel level for the tested pitch. In the example below you can see that the person tested was able to hear a 500hz sound at 30dB and a 1000hz sound at 40dB.
Hearing Test Results
An audiogram will usually show three different results: pure-tone results for the left ear, pure-tone results for the right ear and bone conduction results. The pure-tone tests for the left and right ear are the “normal” hearing test, the one where you wear a pair of headphones and are asked to press a button when you hear a sound. The left ear results are shown as blue lines connecting blue crosses and the right ear is shown as red lines connecting red circles. A bone conduction test is where a small headset is placed just behind one of your ears rather than over it – the results for this are shown as green lines connecting green triangles.
In some cases further advanced audiometry needs to be undertaken. These tests are called masking. They are undertaken under strict rules where your original test shows particular parameters. Masking is undertaken by playing a rushing wind sound in one ear while tones are played to the other. It is done to keep one ear busy, while the other ear is tested.
For examples of real audiograms, have a look at my results, -->Megan’s or -->Sarah’s. You can create your own audiogram using my Audiogram Creator.
You can understand the effects of your audiogram results by reading our article Common Words That Are Difficult To Understand With Hearing Loss